It was surprising to see a price reduction on 5574 Palm shortly after it was first brought on the market. Homes have been selling very quickly and this may just be a strategy to get quick interest, but the Terrace listing at 5574 Palm just reducet the price from $1,439,000 to $1399,000 after just a few days on the market. The home is a which is the smallest of the Terrace layouts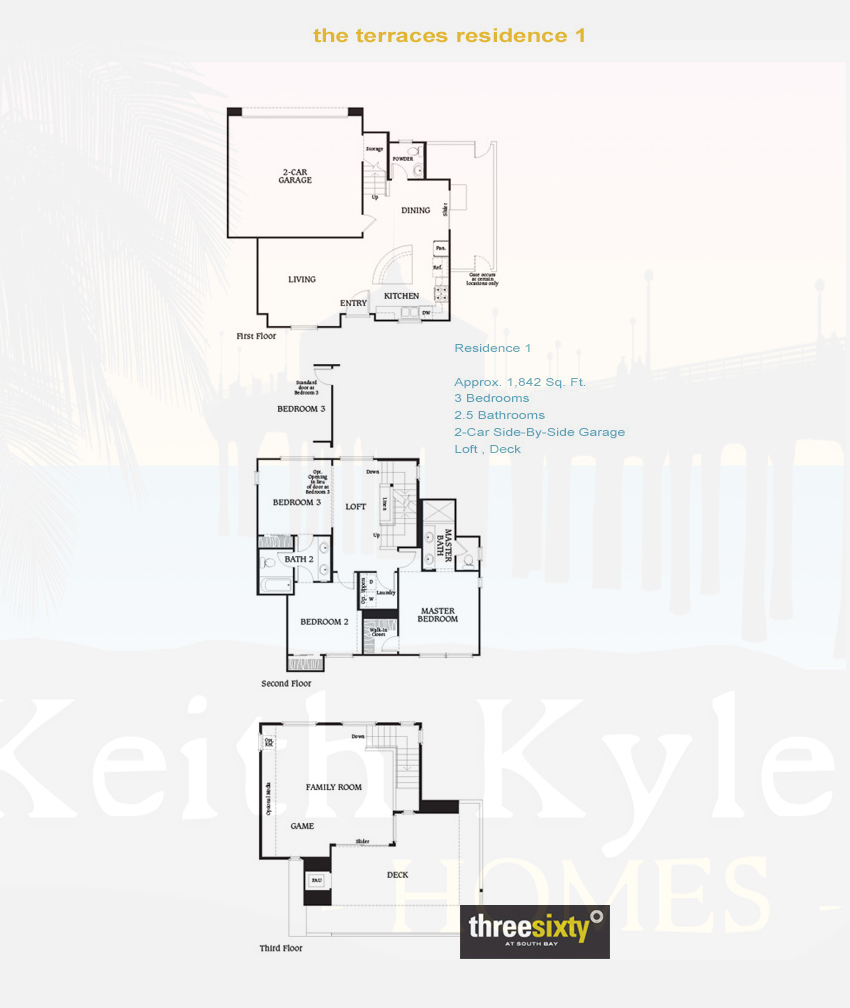 with around 1,861 square feet, 3 bedrooms and 2 1/2 baths.
The freestanding single family home style Terrace unit is now priced at $1,399,ooo. Given the recent close of 5245 Pacific Terrace, which was also a residence 1, at $1,450,000 makes it likely 5574 Palm will sell quickly.
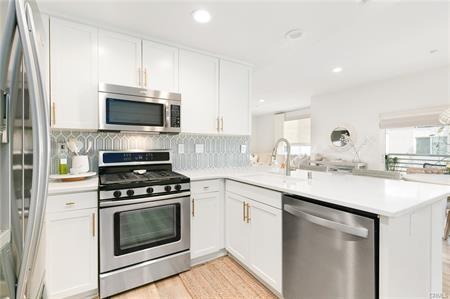
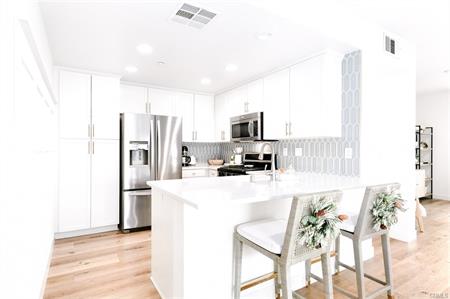
The “Terraces” are single family style homes in 360 with no shared walls and small patios or yards. The HOA fees in the Terrace homes are the lowest in the community. As with all of the homes in Three Sixty 5574 Palm offers central air conditioning, private garage, access to the the incredible 360 community amenities and is part of the award winning Wiseburn School District in Hollyglen.
View the MLS listing details below.
5574 Palm By the Numbers
- 3 bedrooms
- 2.5 bathrooms
- Top floor living room and outdoor deck
- 1,861 square feet (BTV)
- 2 car garage
- $232 HOA
- Priced at $1,399,000
5574 Palm, Hawthorne – Listed for $1,399,000
Listing courtesy of Matthew Barry & Michael Aronski – eXp Realty of California, Inc. 310-308-6685
 with around 1,861 square feet, 3 bedrooms and 2 1/2 baths.
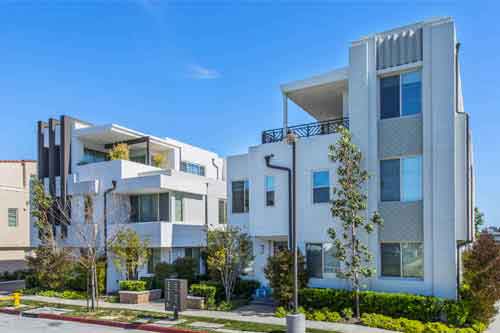
 listed for $950,000 and closed at full price after a brief 17 days on the market. Offering approximately 1,554 square feet (BTV) with 2 bedrooms and 2 1/2 baths. The home featured 2 main levels with the 1st floor being an open concept living, dining, kitchen and powder room. The upper level offers 2 bedrooms each with private bathroom. The conveniently located interior laundry closet is also on the top floor between the bedrooms. Lowest level offers a 2 car attached tandem garage. As with all of
 managed to blow us away. #303 was arguably the nicest condo we had ever seen but with the last Plan 3 Flats 2 bedrooms selling at $830,000, $820,000 and $851,500 (granted the most recent of the three was all the way back in May 2021) it was difficult to even justify the listing price of 13032 Union #303 at $960,000.